Infographics: Visual Storytelling on Social Media
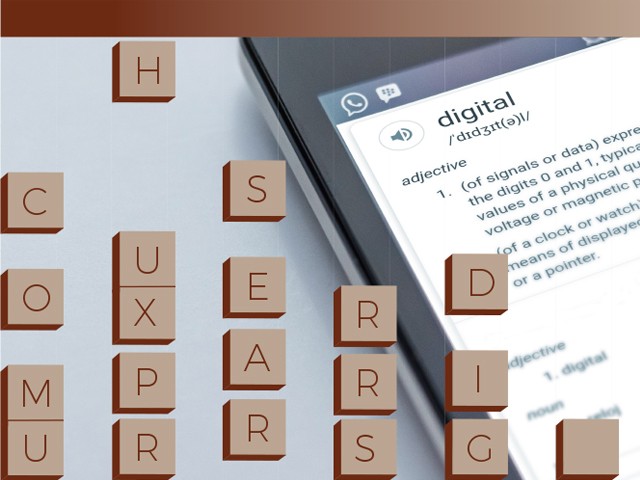
What is visual storytelling?
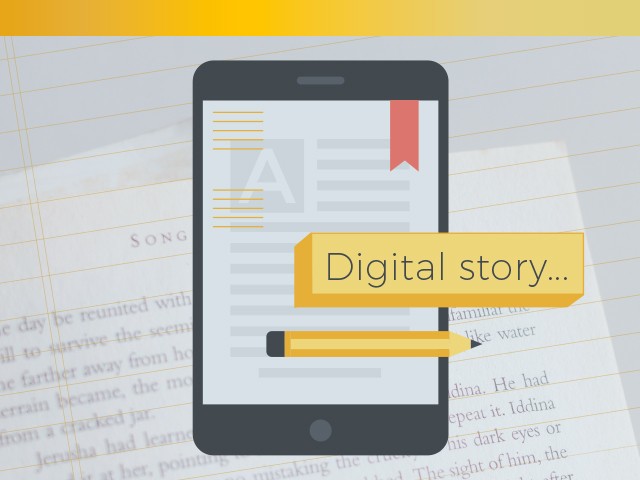
Raw data can often be unwieldy, its patterns and significance difficult to visualize. Infographics can help organisations tell the stories behind the data, delivering information quickly, efficiently and in an aesthetically pleasing package. This guide offers practical tips on how to build powerful, appealing infographics that engage readers even as they tell them impactful stories, such as crafting a logical hierarchy to the visuals and the importance of catchy subtitles. [Go to article]
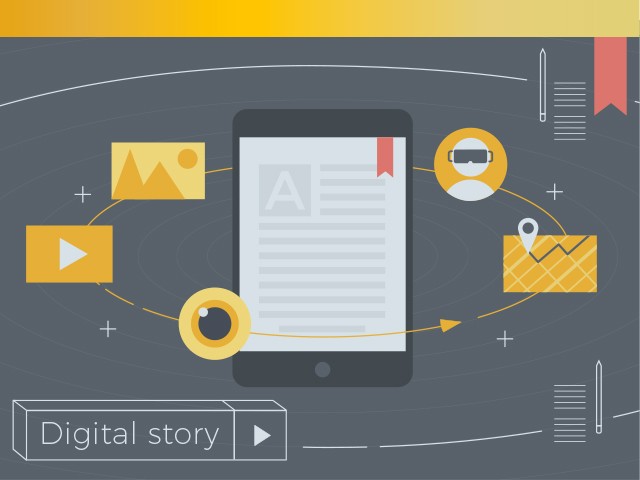
How do you actually build an infographic that is engaging?
Understanding the key elements that make a strong infographic is one thing, but how do you actually go about creating one with no design experience? This video walkthrough details the process, from outlining your goal and what data you will present to the audience, gathering that information, and visualizing, sketching out and stylizing the infographic. The walkthrough offers examples, resources and templates so users can try out their own ideas. [Watch video]